Monitoring TheHive#
The monitoring will allow you to get metrics about the behavior of your TheHive instance: request time, cpu and memory usage ...
TheHive uses the library kamon.io and by default the monitoring is disabled
TheHive ships with the integration for Prometheus reporter.
Other reporters are not included by TheHive. If you would like to see a reporter included by default in TheHive, contact us.
Metrics setup with Prometheus and Grafana#
Here we will setup metrics reporting with Prometheus and Grafana
TheHive configuration#
In your application.conf, add this section to the configuration:
kamon {
    # Activate kamon module - disabled by default
    enabled = true

    # Activate the prometheus reporter
    modules {
      prometheus-reporter.enabled = yes
    }

    environment.tags {
        # Setup additional tags that will be sent to prometheus
        # See https://kamon.io/docs/latest/reporters/prometheus/#sending-environment-tags-to-prometheus
        # ex: env = prod
    }

    # Reference: https://kamon.io/docs/latest/reporters/prometheus/#configuration
    prometheus {
      include-environment-tags = true
      # Start and embedded-server on the provided port.
      # If using docker, make sure that this port is accessbile
      embedded-server {
        hostname = 0.0.0.0
        port = 9095
      }
    }
}
You will need to restart TheHive for the configuration to take effect
To check that the prometheus reporter is working, connect to http://THEHIVE:9095/metrics You should see a list of metrics that are reported by TheHive.
Prometheus configuration#
Add the scrape configuration to prometheus configuration prometheus.yml
scrape_configs:
  # ...  other scrape configs

  - job_name: 'thehive'
    scrape_interval: 30s
    static_configs:
      - targets: ['THEHIVE:9095'] # set the ip or hostname for TheHive
In a dynamic environment like kubernetes, the TheHive service can be automatically discovered by prometheus. You can enable this with labels on your pod or by adding a PodMonitor resource. See the adaquate documentation: Prometheus configuration or Prometheus operator
Grafana configuration#
- Make sure that prometheus is setup as a Datasource inside Grafana
-
Import dashboards or create your own. We recommend the following dashboards (these dashboards were not created by Strangebee):
- Kamon 2.x - API dashboard: see API metrics like throughoutput, latency, % of error status. Note that TheHive frontend uses long polling, some requests take 60 seconds and they will appear as outliers in this dashboard
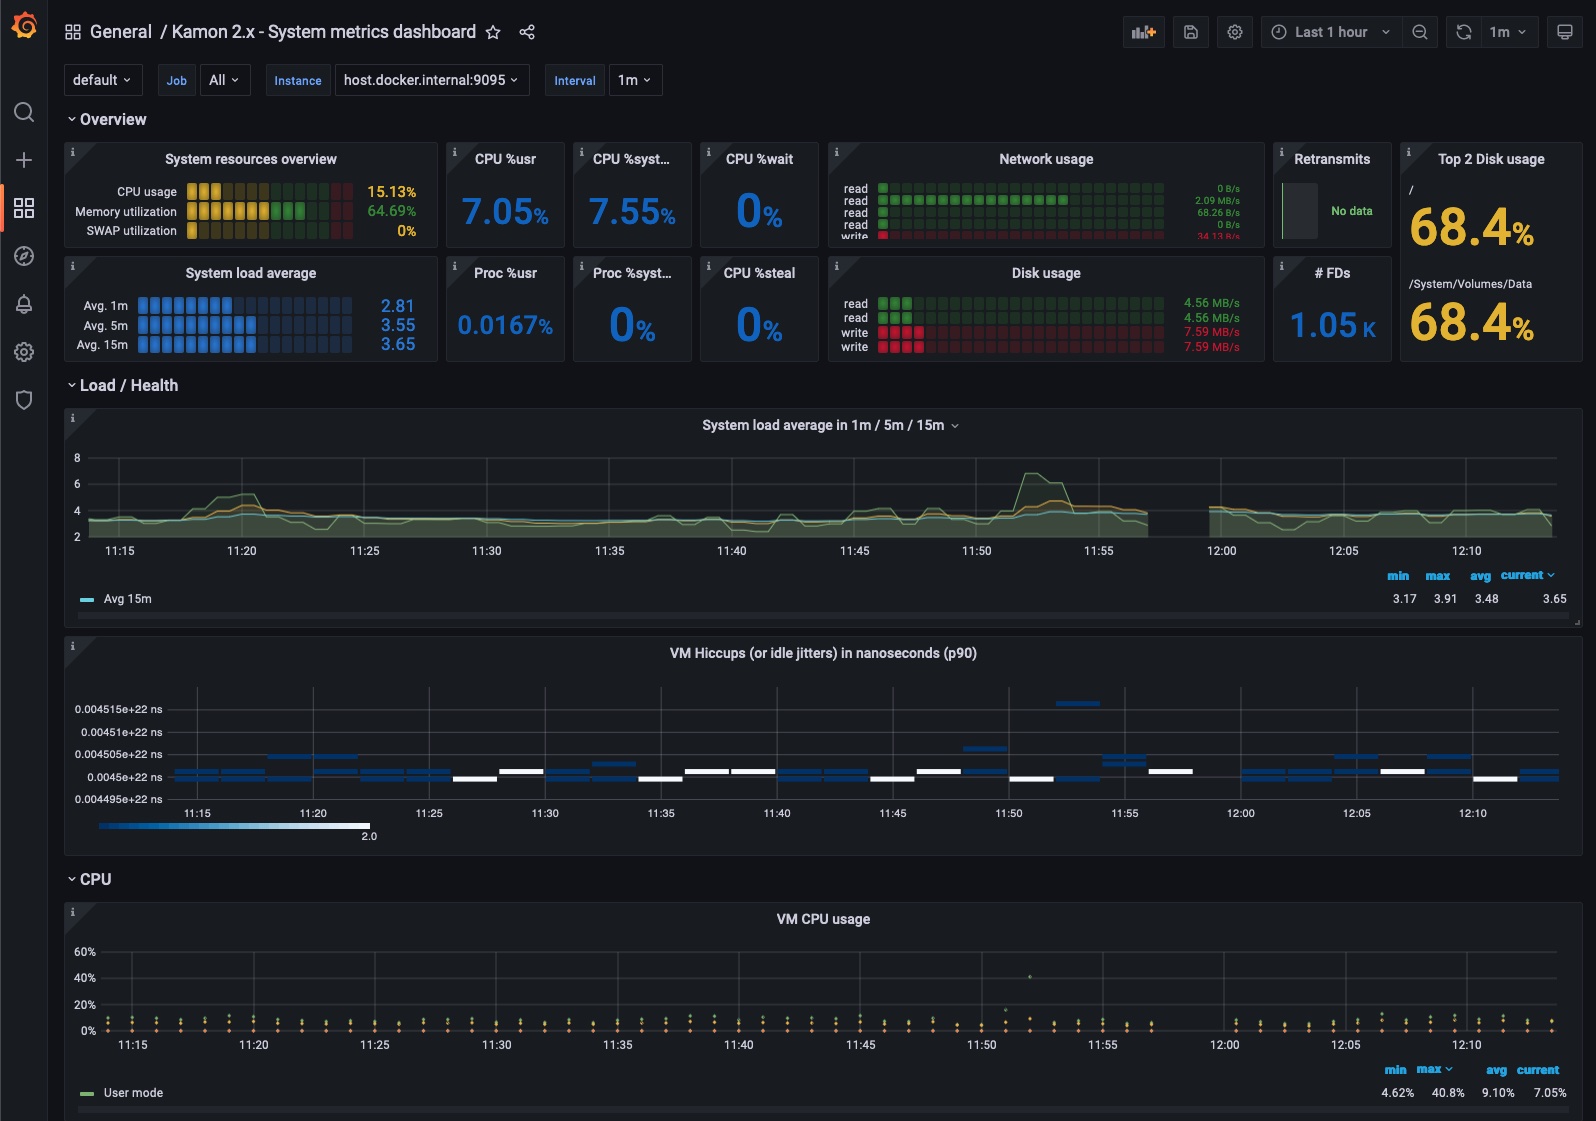
- Kamon 2.x - System metrics dashboard: see info about CPU or memory usage, JVM metrics like Heap usage or GC
- Kamon 2.x - Akka: info about Akka system, actors, processing time
To make these dashboards work, you may need to edit the dashboard variables